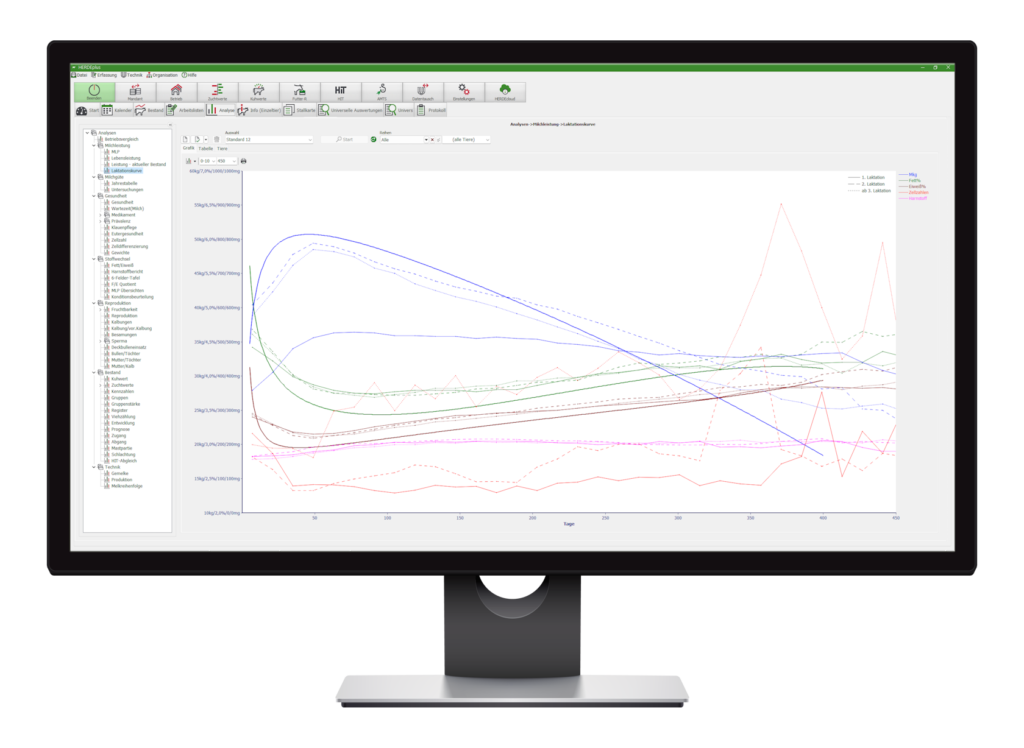
Lactation curve
Discover the world of data analysis with the innovative lactation curve analysis! Here you can freely compare lactation performances, both graphically and in tabular form. In the definition, you individually specify which animals and data volumes are included according to time periods, evaluation levels and services. Each definition consists of a maximum of 7 rows, so all options are open to you. Save different definitions for maximum flexibility. For each row, you define your individual grid with a minimum number of values. Our user-friendly platform makes analyzing lactation curves simple and effective. Unleash the full potential of your data – start now!

