Intensive analysis
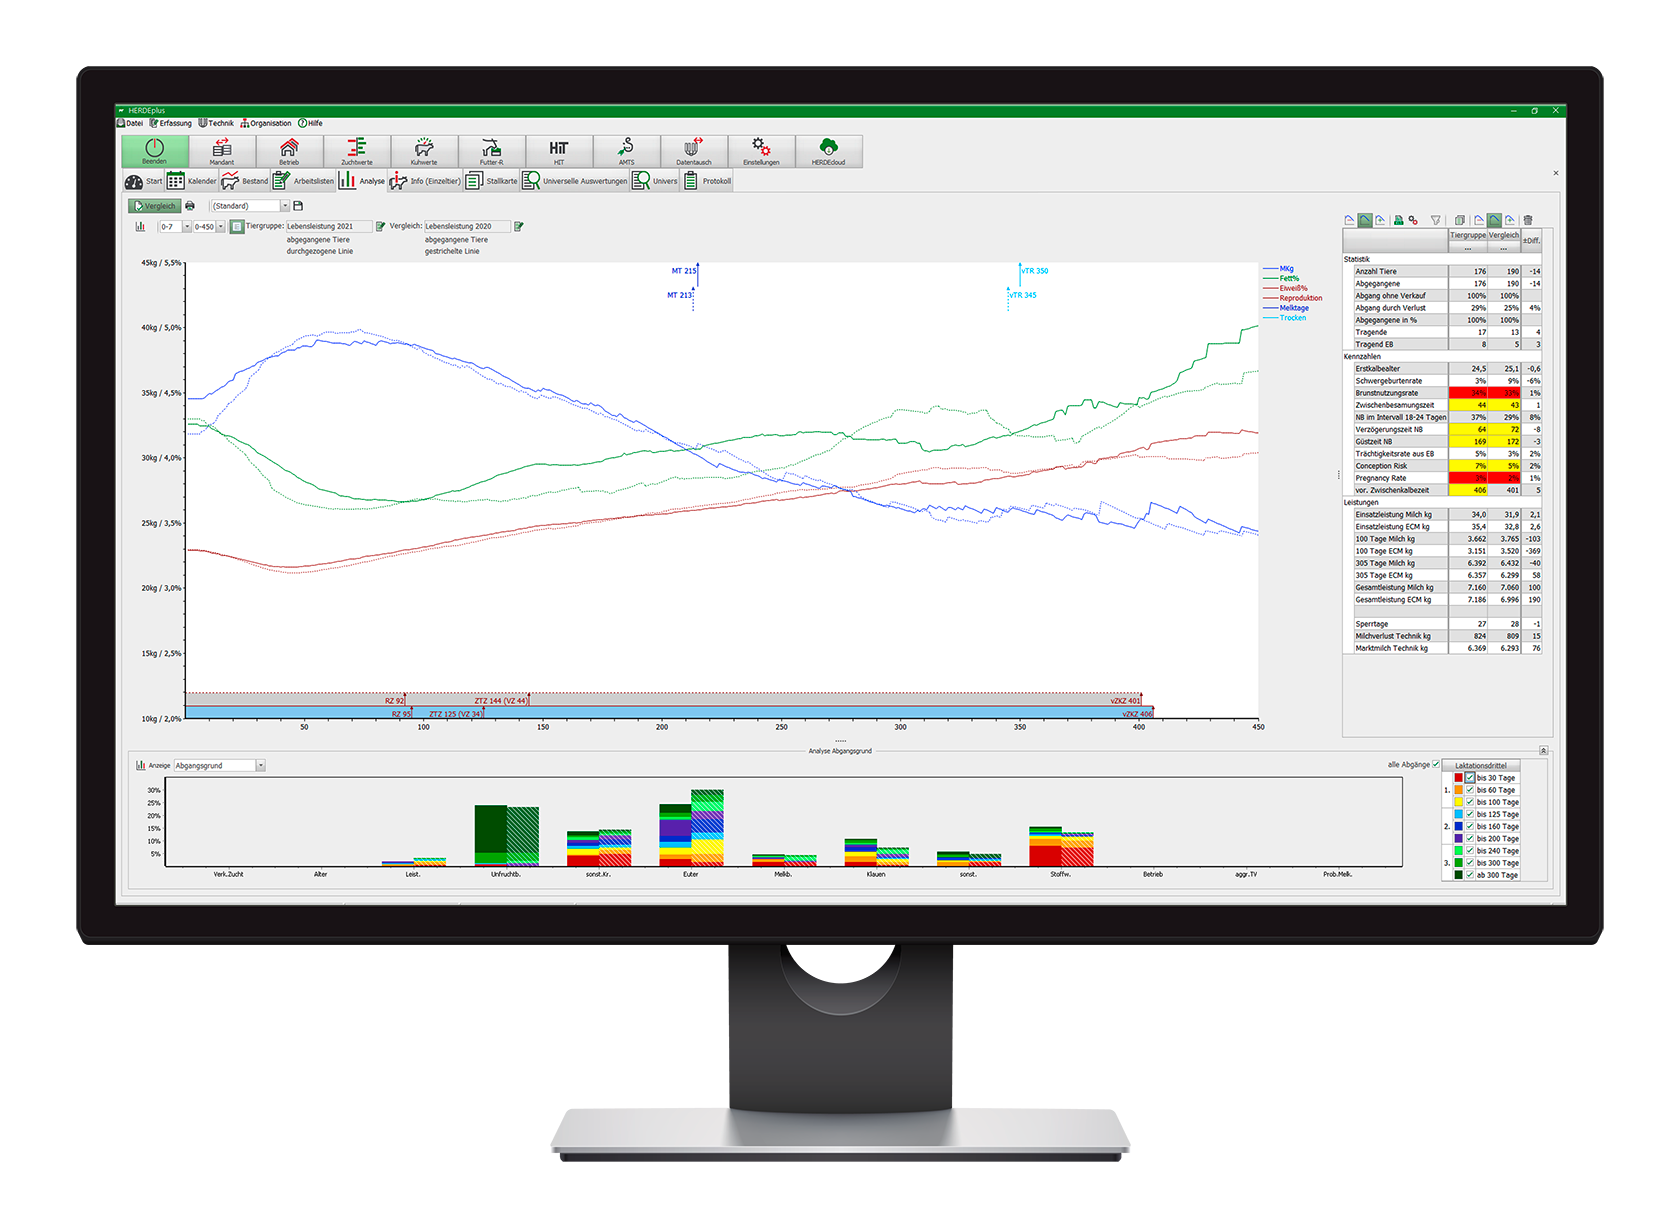
This powerful analysis tool allows you to visualize complex relationships of performance, weaning events, milk yield and especially fertility in a clear and descriptive graphical representation.
The lactation curve, based on MRec and performance parameters, provides you with a detailed and informative display. By simply selecting groups of animals, you have the ability to compare them to other animals and gain relevant insights.
This graphical representation not only provides a comparative view, but also provides all important key figures and a detailed listing of departed animals. This gives you a comprehensive overview of the health and productivity of your herd.
The analysis tool allows you to view all animals from all animal lists, giving you a holistic view of your animals’ performance and fertility. You will be able to identify trends, patterns and correlations that will help you take targeted actions to optimize herd performance.
Overall, this analysis tool provides you with valuable support to make informed decisions, improve herd management and maximize the health and productivity of your animals.